The Automated Readability Index (ARI) was developed by linguists E. A. Smith and R. J. Senter to improve the readability of technical manuals and training materials. Their research was published in November 1967 in a report titled “Automated Readability Index,” prepared at the Aerospace Medical Research Laboratories, Wright-Patterson Air Force Base, Ohio, in collaboration with the University of Cincinnati. This work was part of a project exploring human factors in training system design for the U.S. Air Force.
Understanding the ARI Formula
Most readability indices consist of two factors. One factor is sentence structure or average sentence length. The other factor is word structure based on either the percentage of easy words or the average number of syllables per word. Using a word list has advantages, especially in 4th and lower grades, but it is somewhat inaccurate when applied to adult reading material. Syllable counts are deceptively unreliable as well.
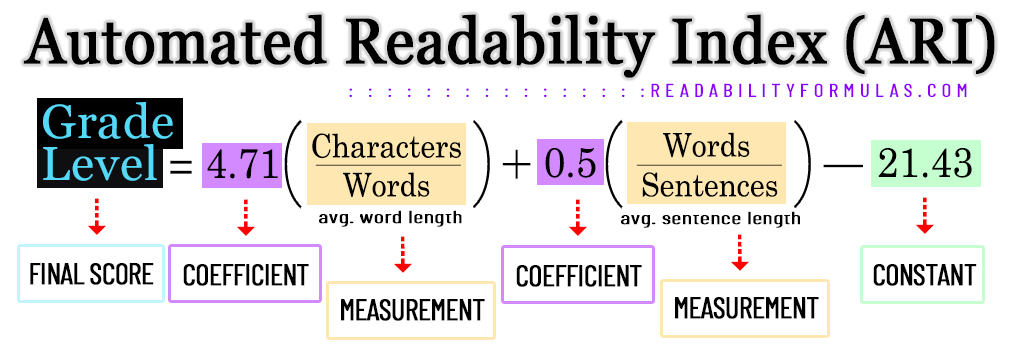
The ARI formula considers the average number of characters per word (AWL) and the average number of words per sentence (ASL). Characters include any letters, numbers, symbols, etc.—except for white space between characters.
The formula is as follows:
$$0.5 ASL + 4.71 AWL – 21.34$$
Automated Readability Index (Simplified)
The result is a numerical score that correlates to a specific grade level. For example, an ARI score of 6.1 indicates the text is readable by a 6th grader, while a score of 12.3 suggests a text fits a 12th-grade level.
Here is a breakdown of grade levels in the U.S. and their corresponding ARI score:
| ARI Score | Grade Level | Reading Level | Ages |
| < 1 | Kindergarten |
Extremely Easy
|
5-6 yrs. old |
| 1 | First Grade |
Extremely Easy
|
6-7 yrs. old |
| 2 | Second Grade |
Very Easy
|
7-8 yrs. old |
| 3 | Third Grade |
Very Easy
|
8-9 yrs. old |
| 4 | Fourth Grade |
Easy
|
9-10 yrs. old |
| 5 | Fifth Grade |
Fairly Easy
|
10-11 yrs. old |
| 6 | Sixth Grade |
Fairly Easy
|
11-12 yrs. old |
| 7 | Seventh Grade |
Average
|
12-13 yrs. old |
| 8 | Eighth Grade |
Average
|
13-14 yrs. old |
| 9 | Ninth Grade |
Slightly Difficult
|
14-15 yrs. old |
| 10 | Tenth Grade |
Somewhat Difficult
|
15-16 yrs. old |
| 11 | Eleventh grade |
Fairly Difficult
|
16-17 yrs. old |
| 12 | Twelfth grade |
Difficult
|
17-18 yrs. old |
| > 13 | College |
Very Difficult
|
18-22 yrs. old |
Understanding ARI’s Calculations
The Automated Readability Index uses coefficients and constants to achieve mathematical accuracy and predict the readability grade level of a text. Here’s why they are essential:
Coefficient 4.71:- What It Does: This number weights the average number of characters per word (a proxy for word complexity).
- Reason: Through regression analysis, the creators E. A. Smith and R. J. Senter determined this factor influences readability the most. Words with more characters are often more complex—readers need more cognitive effort to process. The coefficient 4.71 reflects the number’s importance in predicting readability.
- What It Does: This number weights the average number of words per sentence (a proxy for sentence complexity).
- Reason: Sentences with more words have more complex structures (e.g., multiple clauses), which increases complexity. The coefficient 0.5 indicates that sentence length impacts readability less than word length, but it is still a significant factor.
- What It Does: This is the intercept of the formula. It adjusts the formula to ensure readability scores align with U.S. grade levels.
- Reason: When E. A. Smith and R. J. Senter analyzed text, they calculate this constant as part of the equation to fit the data from the graded texts. Without this constant, the results would not correspond to grade-level readability.
Why These Specific Values?
Empirical Derivation:
- The formula was derived from a large dataset of texts used in U.S. schools.
- E. A. Smith and R. J. Senter performed multiple regression analysis, matching text features (characters per word and words per sentence) with the assigned grade levels of the texts.
- The coefficients (4.71 and 0.5) represent the strength of the relationship between these factors and grade level.
Balancing Influence:
- Word length (characters per word) has a larger coefficient because it strongly correlates with word difficulty.
- Sentence length (words per sentence) has a smaller coefficient because while longer sentences are more complex, they are not as significant a predictor of difficulty as word complexity.
Simplified Explanation of the Formula:
- Characters per word (weighted by 4.71) measures how complex the vocabulary is.
- Words per sentence (weighted by 0.5) measures how complex the sentence structure is.
- The constant (-21.43) adjusts the equation so that the output matches U.S. grade levels.
Strengths of the ARI
1. Simplicity: The ARI calculation is straightforward. It requires only basic statistical information about the text, making it easily accessible to a wide range of users.
2. Widely Used: ARI has been extensively used in educational settings, publishing, and content creation. It’s popular because of its simplicity and its ability to quickly score text readability.
3. Wide Applicability: You can apply ARI to a wide range of texts, including essays, articles, books, websites, and educational materials. Its versatility makes it suitable for various domains and ensures its usefulness in different contexts.
4. Objective Measurement: ARI quantifies sentence length and word length. This eliminates subjective interpretations and assesses readability more reliably.
5. Grading: ARI assigns texts a grade-level equivalent, making it easy for writers and publishers to gauge their target audience. This grading system helps tailor content to specific reading skills.
6. Benchmarking: Writers and publishers can use the formula to compare different versions of text or to benchmark their content against established readability guidelines or standards. This enables them to find ways to improve the clarity and accessibility of their writing.
Limitations of the ARI Formula
1. Sentence Length Bias: ARI may score texts with longer sentences with a higher score, even if the actual content is not inherently difficult to comprehend. Similarly, the formula may score texts with shorter sentences with lower scores, which may inaccurately reflect their true difficulty.
2. Word Difficulty Ignored: ARI does not consider difficult words within a text. Two texts may have similar ARI scores, but one might include complex vocabulary that makes the text harder to understand.
3. Lack of Context: ARI focuses on structural aspects of a text and overlooks the content’s subject matter and conceptual difficulty. Therefore, it does not capture the nuanced complexities of specialized or technical texts.
4. Lack of Linguistic Factors: ARI ignores other important linguistic factors such as sentence structure, vocabulary diversity, and syntax complexity. These factors can impact the readability and comprehension of a text.
5. Subjectivity of Readability Levels: ARI categorizes texts into specific grade levels, but the reading skills and background knowledge of individuals within those grade levels can vary widely. It does not consider the individual differences in readers’ comprehension skills, and therefore fails to capture the true readability experience.
6. Cultural Differences: ARI ignores cultural and contextual variations in language use. It treats all texts uniformly, which may overlook the nuances and complexities specific to certain genres, disciplines, or cultural contexts.
7. Limited Focus on Reader Engagement: ARI does not consider reader engagement, interest, or motivation as factors that contribute to a readable text.
Real-World Applications
1. Education: ARI is used in educational settings to score textbooks and instructional materials for specific grade levels. It helps appropriate reading materials that match students’ reading abilities, ensuring optimal learning outcomes.
2. Publishing and Journalism: Publishers and news organizations use ARI to score articles, books, and digital media. It helps them tailor content to their audiences and ensures the language is suitable for their readers.
3. Content Localization: Translators and localization experts can use ARI to help translate and align content with the target audience’s reading skills and cultural norms.
4. Accessibility Compliance: ARI helps meet web accessibility standards. Content creators can assess and adjust the readability of web pages, ensuring that individuals with diverse reading skills can access and understand the information.
5. Language Learning Materials: ARI is widely used in the development of language learning materials. Educators can match materials to learners’ language proficiency levels, ensuring content engages and challenges them properly.
6. Legal and Government Documents: Legal and government documents often contain complex language and terminology, making them difficult for the public to understand. ARI can help simplify the language and improve readability, enabling better comprehension and accessibility to important information.
7. Improving User Manuals: User manuals and instructional materials can be challenging to comprehend due to technical jargon and complex procedures. ARI can improve the readability of these materials, ensuring users can follow instructions and operate devices or systems safely.
Differences Between the Automated Readability Index (Grade Level)
and Flesch Reading Ease (Reading Scale)
ARI and Flesch Reading Ease (FRE) are two popular readability formulas. Here are the differences:
Calculation Method: ARI scores text based on the average number of characters per word and the average number of words per sentence. It uses a mathematical formula that outputs a numerical score. The FRE formula calculates readability based on the average number of syllables per word and the average number of words per sentence. It also employs a mathematical formula that outputs a numerical score.
Readability Measurement: ARI provides a grade-level equivalent score, indicating the grade level at which readers can understand the text. For example, an ARI score of 8.0 suggests that the text is readable by an average 8th grader. The FRE formula provides a score on a scale from 0 to 100. Higher scores indicate easier readability, while lower scores suggest more difficult texts. A FRE score of 60-70 indicates a fairly easy-to-read text, while a score below 30 implies a challenging and complex text.
Focus on Sentence and Word Length: ARI emphasizes sentence and word length as indicators of text complexity. It assumes that longer sentences and words increase the difficulty of the text, impacting the score. The FRE formula relies on the average number of syllables per word, assuming that a higher number of syllables makes a text more challenging to read. It also considers the average number of words per sentence as an indicator of reading difficulty.
Different Interpretations: ARI provides a more specific and grade-level equivalent score, making it easier to determine the target audience. The FRE score interprets readability more broadly. Although it indicates the overall ease or difficulty of a text, it does not output a specific grade level.
Suitability for Complex Texts: ARI is generally more suitable for assessing the readability of complex texts, such as technical or scientific materials. It focuses on sentence and word length, which may align better with the characteristics of these types of texts. The FRE formula, while useful for general readability assessment, may evaluate complex texts inaccurately as it primarily relies on syllable count. This may not capture the nuanced difficulties inherent in specialized subjects.
| Feature | Automated Readability Index | Flesch Reading Ease (FRE) |
|---|---|---|
| How It’s Calculated | Looks at the length of words and sentences. Gives a number score. | Counts syllables in words and words in sentences. Gives a number score. |
| What the Score Tells You | Gives a school grade level that should understand the text. | Gives a score from 0 to 100. Higher scores mean the text is easier to read. |
| Focus | Pays attention to how long the words and sentences are. | Counts syllables and considers sentence length. |
| Score Meaning | Tells you the school grade that can read the text. | Tells you how easy or hard the text is to read. |
| Best For | Good for more complex texts like science articles. | Better for general reading, but might not be accurate for complex texts. |
| History | Came from studies in the mid-1900s. | Also from the mid-1900s, but not focused on school grades. |
| Easy to Use? | Easy with computers, harder to do by hand. | Easier to do by hand because it’s about counting syllables and words. |
| Where It’s Used | Used in schools and for professional texts. | Used in many places, like schools and for general reading. |
The Automated Readability Index (ARI) is often preferred over the Flesch Reading Ease (FRE) formula due to its grade-level score, its emphasis on sentence and word length, and its suitability for complex texts.
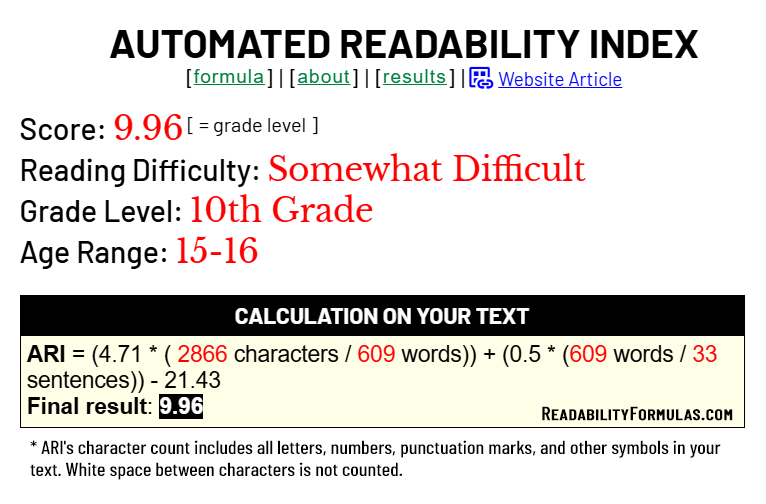
You can score your text using the above formulas with our Readability Scoring System.
Scott, Brian. “How to Use the Automated Readability Index (ARI) Formula for Clearer Communication.” ReadabilityFormulas.com, 26 Jan. 2025, https://readabilityformulas.com/the-automated-readability-index-ari/.


