Free readability assessment tools to help you write for your readers
Reading Levels | Grade Levels | Word Usage | Reader Profiles

In the realm of words, not all texts are created equal. Some dance and sing, accessible to all; others lock themselves away, cloaked in complexity. How do we measure the distance between the reader and the page? Enter the Fry Graph, a tool developed in the 1960s by Dr. Edward Fry that bridges this gap.
Dr. Fry, who worked as a Fulbright Scholar in Uganda, also helped teachers to teach English as a Second Language (ESL) for a few years, from 1963 and onwards. During his early days, he developed readability tests based on graph (A Readability Formula That Saves Time, Journal of Reading (1968)). This graph-based test scored readability through high school; it was validated with materials from primary and secondary schools and results of other readability formulas.
In his book Elementary Reading Instruction in 1977, Fry extended the graph to test through the college years. He discovered that a student’s vocabulary continues to grow and change during college. Fry went on to become Director of the Reading Center of Rutgers University and an authority on how people learn to read.
The Fry Graph has been validated through various studies, including:

Scoring the Fry Graph
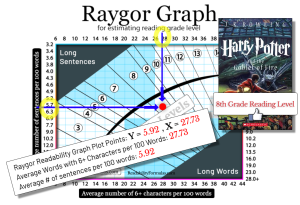
The Fry Graph is simple to use and understand. Take three 100-word passages from a text—beginning, middle, and end. The graph has two axes: the horizontal axis represents the number of sentences per 100 words, and the vertical axis is the number of syllables per 100 words. Plot them on the graph, which is essentially a scatter plot. The point plot will fall within a grade level, indicating the readability of the text.
Step 1: Select 3 samples of 100-word passages randomly (eliminate the numbers from word count).
Step 2: Count the number of sentences in all three 100-word passages, estimating the fraction of the last sentence to the nearest 1/10th.
Step 3: Count the number of syllables in all three 100-word passages. Make a table as follows:
| Number of Sentences | Number of Syllables | |
| First 100 words | ||
| Second 100 words | ||
| Third 100 words | ||
| Total | ||
| Average |
Step 4: Enter the graph with Average Sentence Length and Number of Syllables. Plot dot where the two lines intersect. Area where dot is plotted signifies the approximate reading grade level of the content.
Step 5: If you use an online tool or software, you can process the entire text as a sample.

 Results are invalid if they appear in either the top right or bottom left corner of the dark blue areas.

As you can see, the Fry Graph is not linear. It uses a more complex layout with curved boundaries between grade levels, much like the Raygor Readability Graph. This is because readability doesn’t increase in a straight line. The graph is designed to focus on small changes in syntax, especially in lower and higher grade levels.
For example: In the lower grade levels (Grades 1-3), small differences in count affect readability significantly. As you move to higher grade levels (Grades 9 and above), the boundaries stretch out. This non-linear design makes the Fry graph more accurate in estimating readability for a wide range of texts.
The Fry Graph may feel vintage, but its underlying concept is highly contemporary. Understanding your audience’s reading level isn’t just helpful; it’s essential. The graph is widely used by educators, researchers, publishers, and writers to evaluate and classify texts, particularly for educational purposes.
ReadabilityFormulas.com helps you score your text automatically using The Fry Graph Calculator.
Scott, Brian. “How to Score Your Text with the Fry Readability Graph.” ReadabilityFormulas.com, 2 Mar. 2025, https://readabilityformulas.com/score-your-text-with-the-fry-readability-graph/.