Free readability assessment tools to help you write for your readers
Reading Levels | Grade Levels | Word Usage | Reader Profiles
![]()
Remember the age of chalkboards and squeaky erasers? Fast-forward to now—technology’s taken us on a wild ride straight into the digital classroom. As we’ve swapped chalk for clicks, we can see a fresh challenge on the horizon: How can we ensure online content isn’t a bland buffet of words? Our secret sauce? Perhaps it’s tweaking those old-school readability formulas for the Snapchat generation.
Readability formulas are tools that assess the complexity of written text and estimate the ease with which readers can comprehend it. They use linguistic and statistical measures, such as sentence length, word difficulty, and syllable count, to score a text. Educators and writers have relied on these formulas for decades to score and match reading materials to U.S. grade levels.
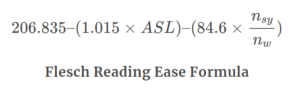
For instance, educators can use formulas such as Flesch-Kincaid Grade Level or Simple Measure of Gobbledygook (SMOG) to estimate the reading level of a text. By analyzing factors such as sentence length, word difficulty, and syllable count, they can determine if the content is suitable for the target readership.
According to a study by the Pew Research Center, 26% of American adults admit to not having read even part of a book within the past year, reflecting the rise of consuming other multimedia forms of information.
![]()
Readability Assessment for Digital Readers
Jumping into the digital realm isn’t just about swapping paper for pixels. There’s a whole universe of videos, animations, and links that beckon with the promise of more info. All of this enhances the reading experience, but it also tosses in a curveball. Readability formulas, originally developed for scoring traditional print texts, need to consider other factors to accurately assess texts for modern readers. As digital reading changes, our measures should too. We want content that works for everyone.
Analyzing data on reading speed, time spent on different sections, and user comprehension can help refine readability formulas for specific learner profiles, leading to personalized learning experiences.
The Nielsen Norman Group conducted a study showing that 79% of users always scanned any new page they came across; only 16% read word-by-word. This indicates the importance of creating content suitable for skimming.
![]()
Case Study 1: Online University
Background: An online university, serving 30,000 diverse students worldwide, noticed students were distracted from heavy-text modules. An internal survey highlighted 60% of students felt overwhelmed or lost in certain modules.
Approach: The university collaborated with an educational research firm to analyze the issue. Using advanced analytics, they pinpointed the areas of content that overwhelmed students. Not only did several text modules surpass the average reading level of their students, but multimedia components, like infographics and videos, contained complex jargon.
Action: To address these challenges, the design team:
Outcome: Within a year the university reported a 25% surge in course completion rates; and 90% of students stated the modules were easier to understand as well as engaging and interactive. The university’s proactive approach became a model for other online education platforms.
A study from the Content Marketing Institute found that articles containing relevant images have 94% more total views compared to articles without images.
Case Study 2: An EdTech Startup
Background: A budding EdTech startup launched an app to help middle school students excel in math and science. The app used interactive lessons. However, pilot studies and user feedback highlighted areas of the app that confused students.
Approach: Students embraced the app’s interactivity, but felt confused deciphering the supporting textual content. The team used the Flesch-Kincaid readability formula on text components and further refined it to encompass multimedia components.
Action: The team introduced a series of improvements:
Outcome: The start-up witnessed a 40% surge in its active user base in six months. Both educators and parents actively began endorsing the app. They especially commended its adeptness at striking the perfect balance: delivering robust educational content while engaging its young audience.
HubSpot’s analysis indicates that 75% of users never scroll past the first page of search results, emphasizing the importance of content readability and keyword optimization.
Case Study 3: Online News Portal
Background: An online news portal for young adults noticed a troubling trend: readers were skimming through articles rather than engaging more deeply, which impacted ad revenue. Analytics revealed a significant dip in the average time readers spent on articles over the past quarter.
Approach: The news portal assembled a team of content strategists and UX designers. Their analysis uncovered that while their articles were rich in content, they often lacked multimedia elements that engaged the young demographic. They revamped their evaluation metrics, placing equal emphasis on infographics, videos, and other interactive components.
Action: Based on these insights, the team:
Outcome: In the coming months, the news portal experienced a turnaround. The average engagement time rose by 18%. This not only led to higher ad impressions but also increased ad revenue.
As of 2021, over 4.9 billion people access the Internet, with a vast majority consuming content in a language that might not be their first, according to the Internet World Stats.
Case Study 4: E-Book Publisher for Children
Background: A children’s ebook publisher had been at the forefront of transforming bedtime tales into digital delights. But, despite having a portfolio of beloved storybooks, the anticipated user engagement fell short.
Approach: To unravel the conundrum, the publisher initiated focus groups of young readers and their caregivers. Their findings suggested that while their stories enchanted and delighted young readers, the digital experience sometimes felt disjointed: the animations and voiceovers didn’t always align with a child’s reading speed or comprehension level. Armed with this knowledge, they modified their readability metrics to factor in animations, interactive touchpoints, and voice narration.
Action: The publisher rolled out several initiatives; they:
Outcome: The publisher saw a transformative change. The average engagement for each ebook skyrocketed by 28%. The platform began receiving glowing reviews from parents, many of whom praised the improved interactivity and the innovative glossary—it made learning new words a delightful experience for their kids.
Data from Orbit Media found that the average blog post takes 3 minutes and 57 seconds to read, suggesting that online readers prefer shorter, concise content.
Case Study 5: Staffing Agency
Background: A global staffing agency prided itself on its expansive online training platform designed to launch the careers of recent college graduates. However, an internal audit unveiled an unsettling trend: the content, though comprehensive, was very dense. College students often lost interest mid-course, leading to low completion and retention rates.
Approach: Committed to recalibrating their e-learning approach, the team used modern pedagogical techniques and considered the multifaceted nature of multimedia and interactive learning modules.
Action: With a clear direction in mind, the team:
Outcome: The impact of these measures was immediate and profound. The agency experienced a 50% upswing in course completion rates. More crucially, post-training assessments painted a compelling picture: students weren’t just completing courses; they were discussing and applying the knowledge.
![]()
Scott, Brian. “From Paper to Pixels: Adapting Readability for Today’s Tech-Savvy Readers.” ReadabilityFormulas.com, 5 Feb. 2025, https://readabilityformulas.com/readability-for-todays-tech-savvy-readers/.